Support and Resistance Levels
A essential concept to understand in Forex is that of Support and Resistance levels.
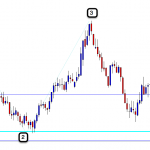
Support and resistance levels help to define the boundaries of a currency’s price movement. Lets start by taking a look at the chart below.

Support defines the level below the current market price where buyers are prepared to come back into the market after a currency pair has fallen.
Resistance defines the level above the current market price at which sellers are prepared to come back into the market after a currency pair has risen. To think of it another way, support is the ‘floor’ and resistance is the ‘ceiling’ to the current asset price.

Support and resistance are in fact the reverse of the same concept. Levels are determined from previous areas of price action where buyers and sellers have competed in the market. Think of them as being memory prints on the market price. Past highs and lows can be psychologically hard for buyers and sellers to break through and significant directional pressure is usually required to cause a break out. This may be triggered by a fundamental change in outlook, such as a change in interest rates or GDP figures.
While support and resistance levels provide boundaries to market price action they do not hold indefinitely. When either level is broken it is referred to as a ‘breakout’. A break of resistance means that the bulls (buyers) have won over the bears (sellers). A break of support means that the bears (sellers) have won over the bulls (buyers). Once this happens the market can be considered to have moved into a new trading range.

When a Support and Resistance Level is broken
It is important here to note the implications of a support or resistance line being broken. When a support level is broken this becomes new resistance to the market price. Conversely when resistance is broken on a chart, it becomes the new support. In the example above we can see how the previous support line is broken when the pair trades through it to the downside. This now becomes a new resistance level.
It generally holds true that the longer the time frame of the chart, the stronger the established support and resistance levels will be. So for example, a support line on a daily chart will tend to be stronger than a support line appearing on an hourly chart.
This is evident especially in trending markets. To establish a trend line in a trending market simply connect the recent lows for support and the recent highs for resistance. For the trend line to be considered valid, we look for a minimum of three “touches” along the line. Until the third touch the trendline cannot be confirmed. It can however be used as a guideline for price action.
Support and Resistance Levels Are Not Exact
Support and resistance levels are not always exact levels. They can also be areas of “congestion” on the charts. These areas of ‘confluence’ can be particularly strong areas for the market to breach and therefore should be treated as stronger than single levels of resistance.
If a currency pair is moving towards a significant support level, this should alert the trader to be on the lookout for signs of buying pressure and a potential reversal. Similarly, if a currency pair is approaching a level of resistance, this can signal the resumption of selling pressure and a potential reversal.
Technical Analysis is an art not an exact science. However by simply being aware of key levels you can improve your trading. Ensure you give trades enough room to ‘breathe’ as often an enthusiastic market can temporarily overshoot support and resistance levels.
Being on the right side of a support and resistance level can be the difference between a winning and losing trade.


