Gold Demand Trends Q3 2018
Q3 demand steady; up 6.2 tonnes (t) y-o-y
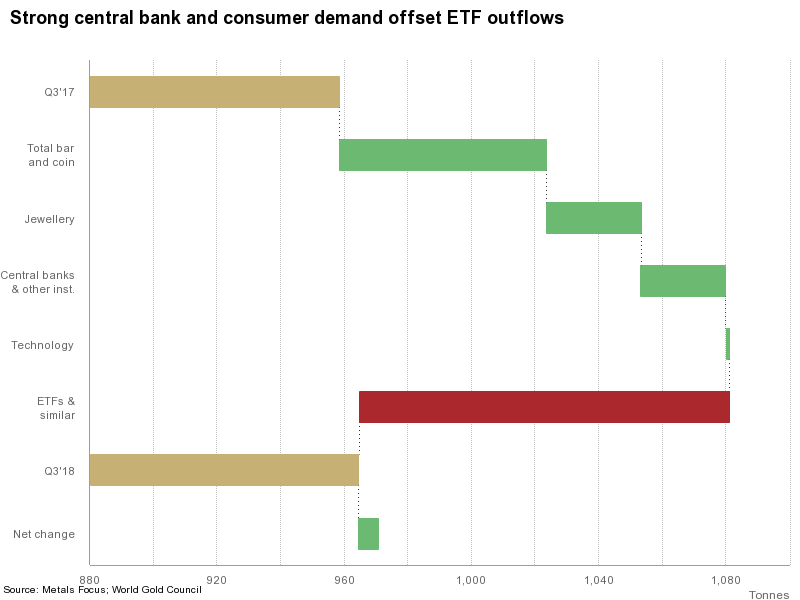
Gold demand was 964.3t in Q3, just 6.2t higher y-o-y. Robust central bank buying and a 13% rise in consumer demand offset large ETF outflows.
- A price drop in many markets created a buying opportunity
- Steep losses on many emerging market stock exchanges spurred a flight to safety
- Concerns about further currency weakness prompted investors in some markets to turn to goldThe world’s largest bar and coin market saw significant growth. Demand in China shot up 25% y-o-y and q-o-q to reach 86.5t in Q3, comfortably above its three- and five- year quarterly average of 71.4t and 65t respectively. Investors flocked to gold in Q3 against a backdrop of financial vulnerability. Domestic equities and bonds have suffered in 2018 as trade war tensions have escalated. The CSI 300, China’s leading equity index, dropped 15% to the end of September, and the credit spread between
Bar and coin demand jumped 28% to 298.1t as retail investors took advantage of the lower gold price and sought protection against currency weakness and tumbling stock markets. Jewelry demand rose 6% in Q3 as lower prices caught consumers’ attention.
A growing number of central bank buyers saw demand in this sector rise 22% y-o-y to 148.4t, the highest level of quarterly net purchases since 2015.
Technology registered its eighth consecutive quarter of y-o-y growth, up 1%. Sharp outflows in gold-backed ETFs offset growth across much of the gold market.
Strong central bank and consumer demand offset ETF outflows
Bar and coin investors took advantage of the price dip; demand rose 28% y-o-y.
Stock market volatility and currency weakness also boosted demand in many emerging markets.
China – the world’s largest bar and coin market – saw Gold demand rise 25% y-o-y. Iranian demand hit a five-and-a-half-year high.
Countries & Governments Are Buying Gold
China, Brazil, Russia, India, and South Africa
Q3 jewelry demand saw price-led y-o-y growth of 6%. Lower gold prices during July and August encouraged bargain hunting amongst price-sensitive consumers. Growth in India and China outweighed weakness in the Middle East.
Central bank gold reserves grew 148.4t in Q3, up 22% y-o-y. This is the highest level of net purchases since 2015, both quarterly and y-t-d, and notable due to a greater number of buyers.
Demand for gold in technological applications rose in Q3 by 1% y-o-y, to 85.3t. This marks the eighth consecutive quarter of growth, primarily driven by gold’s use in electronics such as smartphones, servers, and automotive vehicles.
ETFs shed 103.2t in Q3. ETFs saw a 116t decline when compared with inflows of 13.2t in Q3 ’17, experiencing the first quarter of outflows since Q4 2016. North America accounted for 73% of outflows, fuelled by risk-on sentiment, the strong dollar, and price-driven momentum.
Investment
Significant outflows from gold-backed ETFs; sharp rise in Gold demand
- ETFs shed 103.2t in Q3. North America accounted for 73% of outflows as investors focused on rising equities and strong economic growth
- Bar and coin investors around the world took advantage of the price dip; demand rose 28% y-o-y
- Stock market volatility and currency weakness was a catalyst for demand in many emerging markets
| Tonnes | Q3’17 | Q3’18 | YoY | |
|---|---|---|---|---|
| Investment | 246.2 | 194.9 |  |
-21% |
| Bar & coin | 233.0 | 298.1 |  |
28% |
| India | 31.0 | 34.4 |  |
11% |
| China | 69.3 | 86.5 |  |
25% |
| Gold-backed ETFs | 13.2 | -103.2 |  |
– |
ETFs
Global gold-backed ETFs saw the first quarterly outflows since Q4 2016: AUM fell by 103.2t over the quarter. This represents a 116t decline when compared with inflows of 13.2t in the same period last year. While flows decelerated towards the end of the quarter, September nonetheless was the fourth consecutive month of outflows, creating the longest period of monthly outflows since 2014. This wiped out gains made earlier in the year: by the end of Q3, global gold-backed ETFs had shed 42t. The trend in October, however, seemed to have reversed as ETFs have generally seen positive flows across regions.
The overall decline masks notable regional differences. North America, home to the largest and most liquid gold-backed ETFs, accounted for 73% of outflows in Q3 (around 75t) and almost 90% of outflows over the course of the year so far.
This bearish sentiment towards gold was also present in the US futures market with COMEX reported managed money net longs falling to the lowest level since 2006 and speculative net long positioning turning negative for the first time since 2001.
This is large because of the positive macroeconomic backdrop in the US. Equity markets performed well, with the S&P500, Dow Jones, and Nasdaq all hitting record highs in Q3.
The economy is motoring, inflation is edging up and the Federal Reserve is expected to continue tightening monetary conditions.
And after the low levels of Q1, the US dollar has rebounded and remained relatively strong since. US investors have, by and large, shrugged off concerns around escalating trade war tensions.
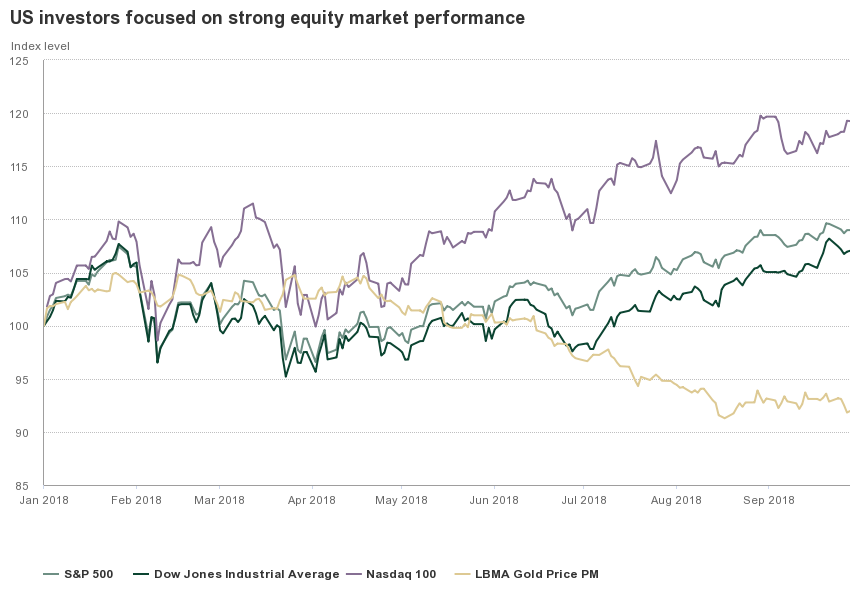
US investors focused on strong equity market performance
